Altostratus Inc. specializes in meso- to micro-scale climate modeling and fine-scale meteorological forecasting for applications in urban climates, urban heat islands, emissions, air quality, thermal-environmental assessments, and building energy use. Altostratus also develops mitigation measures to counter the localized impacts of urban heat in current and changing climates. Meteorological, emissions, and photochemical modeling at Altostratus is performed with state-of-science modeling platforms that are continuously updated and highly customized, including WRF, MM5, CAMx, and CMAQ.
Following is a sample of research activities at Altostratus Inc. This is in addition to activities presented in the Projects and Services pages.
Scroll down through the list.
Example from 25-m WRF forecasting (January 12, 2026, 1500 PST)

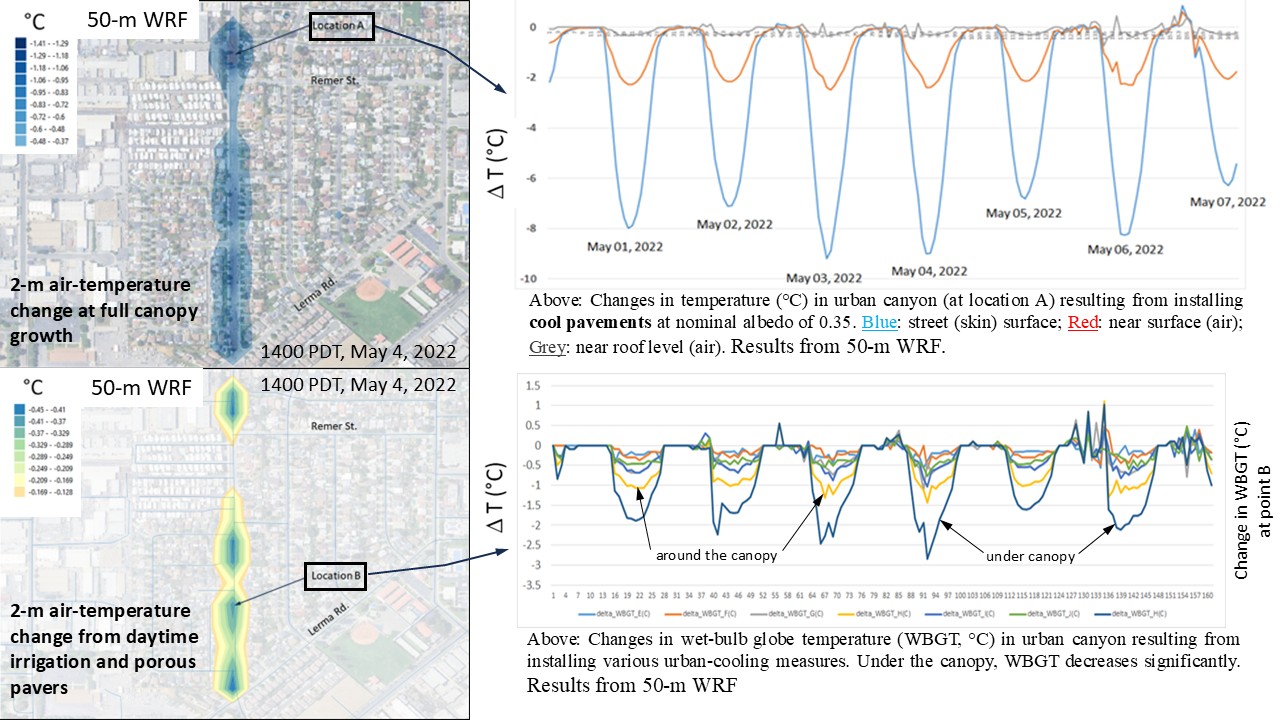
Examples from 50-m WRF: urban canyon effects
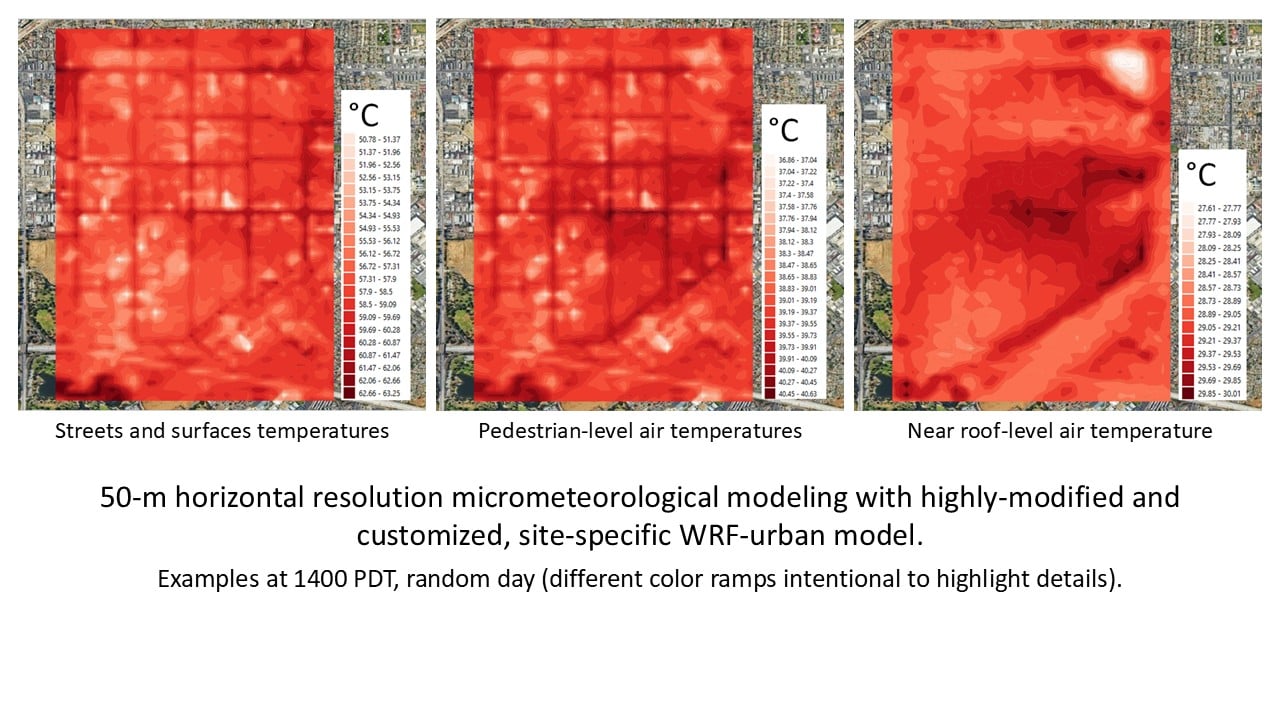
Examples from 50-m WRF: neighborhood scale
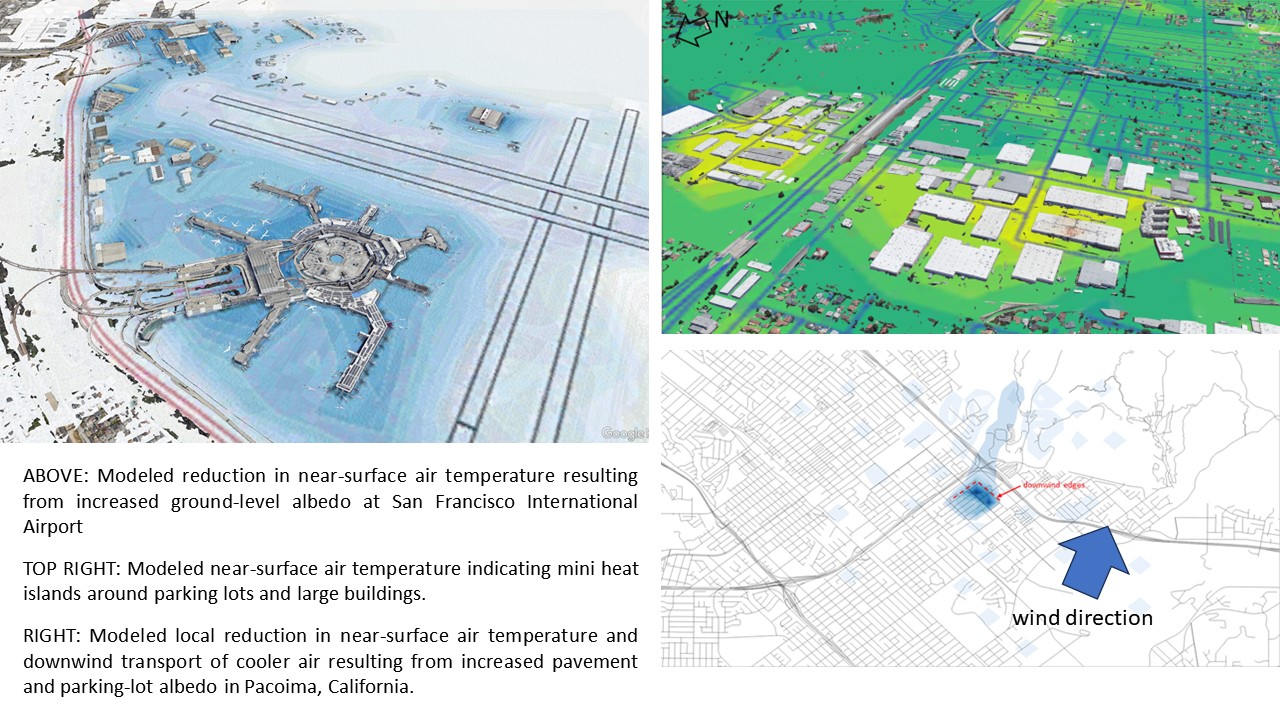
High-resolution prognostic urban micrometeorological modeling
Above examples are from highly-modified and customized WRF-urban model applications at 50-m resolution (50-m WRF) with techniques developed at Altostratus.
An area of research at Altostratus focuses on adapting prognostic atmospheric models for high resolution applications, especially in the urban environment. Altostratus worked extensively with the urban MM5 model (uMM5) in the past and is now continuously modifying the urbanized WRF-ARW model to allow for routine and reliable simulations and forecasts down to 50-m horizontal resolutions (examples above). This is achieved by (1) modifying and improving the data types, derivatives, and site-specific parameters ingested by the model as well as using improved bottom-up pre-processing prior to input, (2) improving the urban parameterizations to account for several urban-canopy-layer processes that were not well accounted for in the past, as well as including effects of vegetation canopies, evapotranspiration, soil moisture, and wind-direction-dependent in-line calculations of various flow parameters, and (3) modifying the model and code so that different urban parameterizations can be triggered simultaneously (invoked at the same time during model integration) at different locations in the domain per actual physical and geometrical characteristics -- not based on land use or idealized climate zones.
The ability to forecast micrometeorological fields at high resolutions is important for outdoor thermal-environmental applications, energy use, emissions/air quality, and street level-thermal comfort assessments.
| |
An Urban Heat Island Index for the State of California
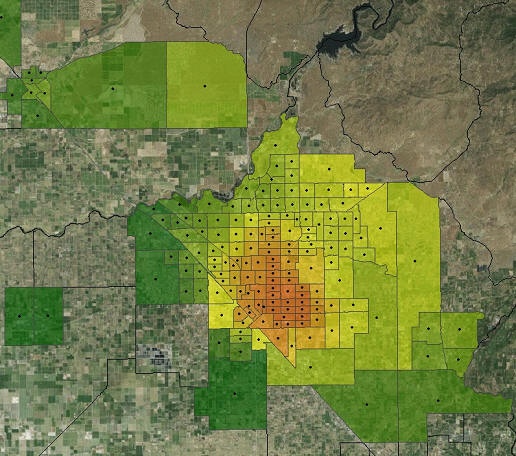
Altostratus Inc. was selected by the California Environmental Protection Agency (Cal/EPA) to develop an Urban Heat Island Index (UHII) for the State of California. The UHII was developed for 50 urban areas in California at the census-tract level (~1 km resolution) based on meteorological modeling with the WRF-ARW that was modified and customized in this study to suit the specific needs of this application. The ultimate goal of developing the UHII is for use in assessing the potential heat-health impacts of urban land use and heat islands (UHIs), identifying geographical areas where UHIs can further exacerbate environmental health issues, and as an additional layer of information for use with the CalEnviroScreen tool. The UHII is an indicator to the exacerbation of heat by urban areas.
The UHII spatial pattern was classified into small, large, inland, urban archipelago, and coastal areas, as well as single or multiple-core UHIs. Because of the large number of census tracts analyzed and because of the varying microclimates in California, there is correspondingly a large range of UHI and UHII values in different regions. At the lower end of the scale (in smaller urban areas), the UHII ranges from 2 to 20 DH/day (°C.hr/day) whereas at the higher end (larger urban areas), it reaches up to 125 DH/day or more. The largest average temperature difference (largest average UHI) in each region ranges from 0.5 – 1.0°C at the lower end and up to 5°C or more at the higher end. The model also shows that urban areas with relatively well-defined boundaries (i.e., urban islands) typically exhibit single- or multi-core UHIs. On the other hand, large urban archipelagos and coastal regions, such as the Los Angeles Basin and the Santa Clara Valley, consist of sustained and contiguous urban land use with no well-defined boundaries, except for breaks by topography. In this case, the UHII often peaks in areas near the downwind edges of the archipelagos. Thus whereas in urban islands the local UHI is mostly a result of local processes that are strongly tied to local land-use properties, the UHI in an archipelago / coastal areas additionally includes the superimposed signals from 1) on-shore warming and 2) upwind urban warming.
The modeling results also capture the synergies between the UHI and regional climate. Compared to cooler periods, warmer weather, e.g., during a heat wave, enhances the UHI and shifts the UHII towards larger values. The implications are that as heat waves could possibly become more frequent in the future, they can intensify the UHIs in many regions, further exacerbating heat stress in urban areas. Thus mitigation or adaptation measures will become more important in the future. Coastal urban areas with deep basins and catchment zones, such as the Los Angeles basin and the Santa Clara Valley, exhibit a different pattern of UHII shift during warmer weather because of stronger local venting during such conditions. In these cases the temperature, while larger in absolute values than during the cooler periods, becomes more uniform across the basin and thus the UHII, by definition becomes more uniform.
The study report can be accessed at the Cal/EPA website  at this location. Furthermore, the Cal/EPA UHI website with data and maps generated in this study can be accessed
  at this location.
Also see paper in the journal Climate:  https://doi.org/10.3390/cli5030059
| |
Urban Heat Island Research
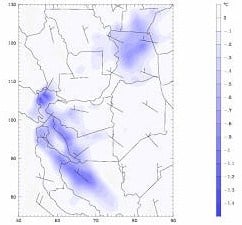
Since 2003, Altostratus Inc. has been performing extensive, multi-scale, state-of-science atmospheric modeling and analysis of urban heat islands and their mitigation for the California Energy Commission (CEC). Prior to that, between 1992 and 2003, Dr. Taha (then a Staff Scientist with the Lawrence Berkeley National Laboratory) led modeling for multi-state evaluation of the energy, meteorological, and air-quality impacts of heat island mitigation. One goal of this research is to help facilitate the deployment of heat-island control measures. The urban heat island modeling and research at Altostratus is undertaken at the meso- and meso-urban scales. A region-by-region evaluation of heat-island control is performed to determine the resulting positive and/or negative impacts on the environment, i.e., where heat-island mitigation would be effective and where it would not (based on climate, land cover, and urban characteristics, etc.). The modeling is then focused on those areas where mitigation would be most beneficial.
The extensive multi-year modeling of those areas shows that the implementation of heat island control can help reduce energy use, reduce emissions, and reduce air pollution, e.g., slow down the photochemical production of ozone. These areas can be cooled by up to 2-3C. The multi-episodic and seasonal modeling of major metropolitan areas in California, for example, shows that the cooling effects from heat-island mitigation are relatively consistent regardless of the variations in local summer weather conditions. In terms of air quality, the impacts on reducing ozone concentrations are significant and can help several regions attain or maintain the air quality standards. For example, the largest daily reductions in 1-hour average ozone can range from 2 to 8 ppb (or more) in various areas in California. Reductions in the 8-hour peak can reach up to 2-3 ppb. The modeling also suggests that heat-island control is not always desirable; there are times at certain locations when heat island control can adversely impact flow and mixing and can thus increase ozone concentrations. While such events are relatively shorter, they nevertheless highlight the need to tailor the mitigation strategies for each region according to its local climate, emissions, and urban characteristics, so as to minimize any potential negative impacts.
Over the years, Altostratus has developed data, information, and findings about urban heat islands and their mitigation potentials. Of note is that the mitigation measures can be equally effective regardless of whether urban heat islands exist or not. In other words, even if an urban area is cooler than its surroundings, the mitigation measures will still have an impact.
In the U.S., many energy, environmental, and regulatory agencies have shown interest in one aspect or the other of the heat-island mitigation portfolio as a potential strategy to reduce energy use, reduce emissions of ozone precursors and carbon dioxide, improve air quality, and ameliorate ambient conditions.
Also see paper in journal Sustainability:  https://doi.org/10.3390/su13179709 and a paper in journal Climate:
 https://doi.org/10.3390/cli6020053
| |
Atmospheric Impacts of Solar Photovoltaic Arrays
Solar photovoltaic (PV) technologies have many benefits. The direct benefits are those of providing electricity and the indirect ones are those of avoiding power generation, e.g., from fossil fuel combustion. The latter translates into reduced emissions of greenhouse gas and other pollutants, such as ozone precursors, thus reducing the atmospheric loading of particulates and ozone, reducing associated radiative-forcing effects, and improving air quality.
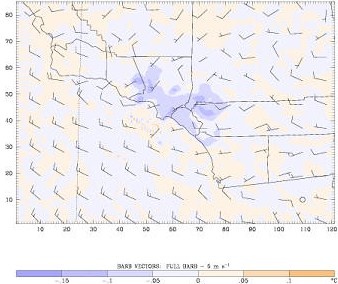
One question that has been raised recently is whether large-scale deployment of solar PV arrays in urban environments can inadvertently impact the atmosphere, e.g., air temperature, and if so, what could be the magnitude of such impacts? Thus the goal of this effort at Altostratus Inc., in a project performed for the California Energy Commission, is to identify the parameters needed to quantify such potential impacts on the atmosphere and evaluate their magnitudes. The meso-urban atmospheric effects of PV deployment were evaluated via simple energy-balance calculations as well as full and detailed atmospheric modeling for the Los Angeles Basin as an example. The meteorological modeling shows that under present-day conditions and with a reasonably high level of PV deployment, that at solar conversion efficiencies of up to 15%, the impacts of deploying solar PV in the Los Angeles area are virtually non-existent. In other words, there are no negative impacts on air temperature or the wind field. When the solar conversion efficiency reaches 20% or higher, some ambient cooling (up to 0.15C) can occur as a result of PV deployment.
In a hypothetical scenario of future cool cities where high-albedo is implemented on urban surfaces (roofs, streets, walls, parking lots, etc), the modeling again shows no impacts on air temperature all the way through conversion efficiencies of 25%. At an efficiency value of 30%, some small cooling effects (0.05C) from solar PV deployment become noticeable. However, with extremely high levels of PV deployment under future-year scenarios of cool cities (a hypothetical situation), and at a conversion efficiency of 10%, the deployment of solar PV can cause an increase in air temperature in the Los Angeles Basin. The increase is small, reaching up to 0.1C. But at a conversion efficiency level of 25%, the effect of PV deployment becomes one of cooling the area by as much as 0.15C. With higher conversion efficiencies, expected in the future, the ambient cooling effect will be larger.
It is important to note that these results are specific to the Los Angeles Basin and the assumptions made in the study. While the results can provide an idea for anticipated impacts, they are non-transferable to other regions. For each region, specific analysis and modeling must be carried out to evaluate the local impacts of PV deployment.
Also see paper in journal Solar Energy:  https://doi.org/10.1016/j.solener.2012.09.014
| |
Modeling in Support of an Urban Forest Control Strategy
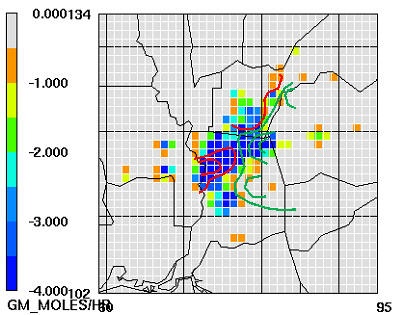
Altostratus Inc. has performed meteorological, emissions, and photochemical modeling for the Sacramento Metropolitan Air Quality Management District (SMAQMD) in support of its development of an urban forest control strategy. Among a host of potential ozone air-quality control measures, the SMAQMD and the Air Districts in the region are considering and evaluating the feasibility of using urban reforestation (replacement of high-emitting species with a lower emitting mix) to help the region attain and maintain the 8-hour ozone standard. Urban forests can impact air quality via several means, e.g., emissions, deposition, meteorological, and photochemical pathways. The goal of this modeling effort includes developing and updating a state-of-science modeling system, developing higher-resolution data (surface, canopy cover, meteorology, biogenic emissions, carrying capacity) and simulations to better quantify the meteorological, emissions, and air-quality impacts of an urban forest program in the Sacramento Federal Non-Attainment Area (SFNA).
The modeling shows that as a result of canopy-cover increase over time, the urban area experiences a cooling effect. For example, by the year 2018, the maximum cooling in the afternoon reaches up to 0.7C to 1.1C during the different days of a future-year episode. By the year 2023, the largest daily afternoon cooling reaches up to 1 to 1.3C. With the addition of 2.5M trees in the SFNA in 2023 , the maximum daily cooling reaches up to 1.8C. In terms of ozone air-quality, the modeling shows a range of impacts depending on the scenario and level of changes in canopy cover or in species makeup. The largest daily reductions in 1-hr average ozone (domain-wide in the SFNA) resulting from a control strategy of replacing 650,000 "business-as-usual" tree species with a lower-emitting mix reach up to about 0.5 ppb. In more aggressive urban forest scenarios, the largest daily reductions can reach up to about 3 ppb in the SFNA.
In terms of the 8-hour average ozone, the episodic maximum is reduced by up to 0.15% by the control strategy. The impact of more aggressive urban-forest programs examined here is a decrease of up to 2% in the 8-hr peak. The impacts of the control strategy on population-weighted exceedance exposure (PWE) to ozone above the NAAQS (120 ppb) and CAAQS (90 ppb) thresholds reach up to 3.5% and 6.0%, respectively. For more aggressive scenarios involving only emissions changes (replacement of high-emitters with lower-emission mix), the largest reductions in PWE reach up to 31% relative to 120 ppb and up to 12% relative to the 90-ppb threshold for one episode and up to 34% relative to the 120-ppb threshold and up to 8% relative to 90 ppb in another episode. In scenarios involving changes in canopy cover, emissions, and meteorology, the impacts on PWE can be larger.
Also see paper in journal Sustainable Cities & Society:  https://doi.org/10.1016/j.scs.2015.11.004
| |
Urbanization and Cloudiness
Of interest in the climate community is the potential role of urban-scale processes on convective instability, cloud formation, and precipitation. Mechanisms by which urban areas can exacerbate cloudiness and precipitation include (1) enhanced convergence due to increased surface roughness and drag in the urban environment; (2) convergence due to heat-island circulation, e.g., when background wind speed falls below certain thresholds, (3) destabilization due to urban heat island’s thermal perturbation of the boundary layer; (4) enhanced formation of aerosol and cloud condensation nuclei in the urban heat-moisture-pollution plumes; and (5) diversion of precipitating systems by the urban canopy and related processes. This effort, performed for NASA, was also undertaken to partially assess the impacts of urban canopy parameterizations on wet microphysical processes, focusing on the Houston-Galveston TX region as a case study. The goal was to evaluate the hypothesis that when urban dynamic factors (e.g. convergence, fluxes, and destabilized boundary layer) interact with sea breeze dynamic factors, they provide the primary mechanisms that can enhance convective precipitation over and downwind of Houston.
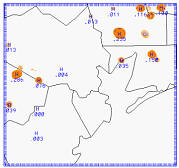
The study used an urban-canopy parameterization (UCP) "urbanized" mesoscale model (uMM5) for improving the quantification of urban canopy layer (UCL) meteorological fields and their impacts on temperature, flow field, and precipitation. Results from the UCP model were also evaluated against those from conventional non-UCP mesoscale modeling. The urbanized model reproduces some aspects of the observed cloud-water field. For example, through 0900 CST on July 25th (2001) the model shows no precipitation or significant amounts of cloud water. At most, only trace amounts are simulated, e.g., smaller than 0.1 mm of column integrated cloud water, downwind of Houston’s urban core (area of low-level convergence). At 1000 CST, relatively more cloud water is produced, initially parallel to the shoreline (along the sea breeze front) and reaching to just south of Downtown Houston. At that time it amounts to up to 0.8 mm. After that, it is advected northwest with the sea breeze and increases in magnitude to up to 3.5 mm at 1300 CST (1900 UTC). It then begins to decrease in intensity and spread out.
The uMM5 simulates enhanced precipitation downwind of the city, in areas of flow convergence. In most hours when there sea-breeze-advected precipitation is non-existent, the model suggests that the area over and downwind of Houston develops its own precipitation, even if only by small amounts. When the cloud-water field is further advected to the northwest by the sea-breeze circulation, two effects can be noticed: that upwind of the city, there is relatively low precipitation, whereas downwind of the urban core, precipitation is enhanced where convergence occurs. In general, the results tend to qualitatively support the hypothesis that the urban core can enhance downwind cloudiness and precipitation.
Continued research in this area and the quantification of urban-enhanced cloud cover is important when evaluating the potential impacts of heat island control in summer in regions where convective cloud formation is significant. The goal is to understand the potential implications of urban cooling on local cloud formation and, in turn, the effects on solar radiation at the surface and on precipitation.
| |
City-Scale Energy Measures
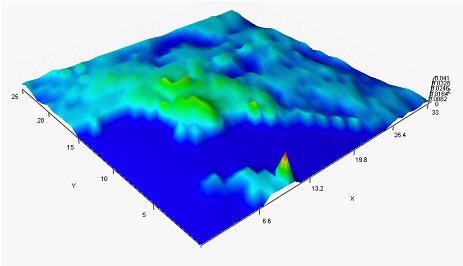
For the California Energy Commission (CEC), Altostratus Inc. performed extensive meteorological modeling to develop a comprehensive system (tool) that ranks the effectiveness of various city-scale energy measures by their indirect atmospheric impacts. The tool is intended for use by planners when developing new areas or extending existing urban zones. The energy measures are ranked according to their atmospheric impacts depending on each region's climate and land-use/land-cover characteristics. The project focused on California (initially) and replaced its standard 16 regulatory climate zones with 180 fine-resolution microclimates. The impacts of energy measures were then evaluated and ranked for each of these 180 microclimates using idealized city configurations. Each idealized community within a city was constructed based on the characteristics of its nearest urban neighbor. In addition, three selected Californian metropolitan areas were also modeled (Sacramento, Fresno, and Los Angeles).
The city-scale measures were evaluated in standalone fashion as well as in several combinations with each other. These measures included: 1) wind energy generation, 2) solar photovoltaic, 3) passive solar systems, 4) high-albedo roofs, walls, pavements, streets, and highways, 5) runoff control, 6) structural shading, 7) canopy cover increase for buildings, parking lots, and streets, 8) green roofs, 9) green walls, and 10) control of anthropogenic heat emissions. The impacts of these measures on the environment were evaluated with various metrics, including changes in heating/cooling degree-days, temperature, moisture, and heat fluxes.
The project used a state-of-science new generation urbanized (meso-urban) meteorological model, uMM5, discussed elsewhere in these web pages. As part of the input to the model, the characterization of each of the 180 zones was done for 1) land-use/land-cover and 2) climate/meteorology. The potential for deployment of each measure in each of these zones was then based on this detailed land-use/land-cover analysis along with urban fabric characterization.
Also see paper in the journal International Journal of Low Carbon Technologies:  https://doi.org/10.1093/ijlct/ctt010
| |
 Link caption
On-line Coupled Chemistry to Meteorology Feedbacks in Modeling
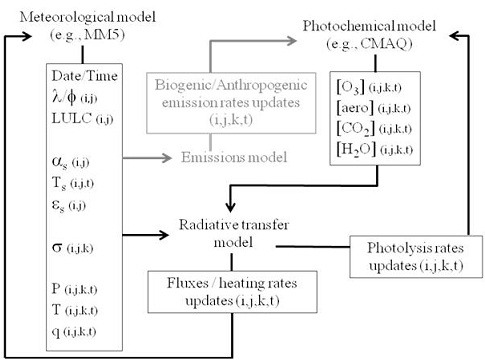
Most current research-grade and regulatory air-quality modeling is based on configurations whereby chemistry-transport/photochemical models are driven by 4-dimensional meteorological fields, produced by a meteorological model, in off-line mode. The configurations may also include instantaneous emission corrections to reflect the effects of changes in temperature and solar radiation. While feedback from photochemical models to meteorological models has not been fully implemented in frameworks typically used in the U.S., significant efforts in this direction have been underway recently. In addition, models such as the on-line chemistry versions of MM5 and WRF also aim at establishing some chemistry-to-meteorology feedbacks; however, except for aerosol/cloud radiative effects, they account mostly for one direction of interaction (meteorology to chemistry).
One task in this NSF-funded project at Altostratus Inc. in collaboration with Portland State University was to develop an on-line coupled modeling system which includes chemistry-to-meteorology feedback capabilities to account for the effects of changing air-pollutant concentrations during model integration. The focus, initially, was only on the radiative-forcing effects of ozone (direct effects). The effects of changes in atmospheric aerosol loading, both direct and indirect, are not yet accounted for in this system (aerosols are specified by either urban or background tropospheric profiles, depending on geographical location). The system is based on the MM5, CMAQ, and Streamer models.
The coupled meteorological / emissions / radiative-forcing / photochemical modeling system was developed and, as a test, applied to the episode of 23-31 July 1998 in Portland, Oregon. Modeling results show that the inclusion of radiative-forcing feedback produces small but accountable impacts. For the selected region and episode, stand-alone radiative-transfer simulations, i.e., evaluating the effects of radiative forcing independently of changes in meteorology or emissions, suggest that a change of 1 ppb in ground-level ozone is approximately equivalent to a change of 0.017 W m-2 in radiative forcing. In the on-line, fully-coupled simulations, where the meteorological dependencies are accounted for, domain-wide peak ozone concentrations were higher by about 2 ppb or slightly more (relative to a simulated peak of 119.4 ppb) when including the effects of radiative-forcing feedback. A scenario of 10% reduction in anthropogenic emissions of precursors produced slightly larger decreases in ozone, an additional 1 ppb in local-peak reductions, relative to scenarios without feedback.
The inclusion of radiative-forcing feedback as in this on-line coupled modeling system is important in certain applications, for example when evaluating policy-relevant background ozone concentrations in various airsheds, especially those with significant air quality problems and large emissions. In such cases, a large drop in emissions (resulting from reducing anthropogenic ozone precursor emissions) will have a significant impact on ozone production and thus on radiative forcing (and related feedbacks).
Also see paper in the journal Boundary Layer Meteorology:  https://doi.org/10.1007/s10546-010-9533-9
| |
Urbanized Meteorological and Air-quality Modeling
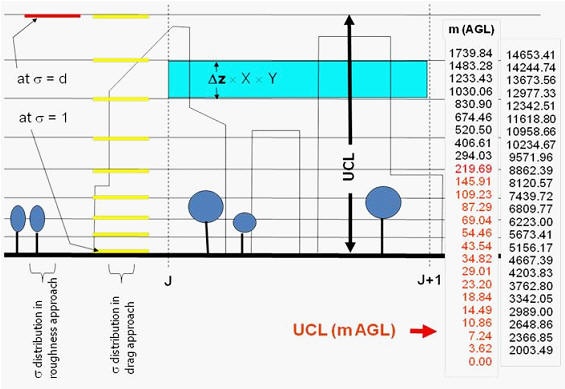
At Altostratus, several on-going activities relate to fine-resolution atmospheric modeling. These include: 1) development and update of urban parameterization schemes in models, 2) development of urban canopy parameters for several regions in the U.S., 3) development of fine-resolution emission inventories, and 4) application of urbanized models, e.g., uMM5, in various studies. Altostratus projects that have used uMM5, fine-resolution photochemical models, and fine-resolution data include: 1) modeling the New York City region for the Department of Meteorology at San Jose State University in support of the Department of Homeland Security's New York Urban Dispersion Project, 2) modeling the Houston-Galveston TX region in evaluating urban heat island effects and air-quality impacts of emission control measures, 3) modeling of central and southern California airsheds for air quality and emission control strategies (for the California Energy Commission), and 4) modeling in support of a control measure development for the Sacramento region (for the Sacramento Metropolitan Air Quality Management District).
Using the UCP / urbanized models produces more accurate results than with only mesoscale, non-UCP models, and can capture fine-resolution canopy-layer phenomena of relevance in planning and design of emission control or mitigation strategies. The more resolved meteorological fields from the UCP models also allow for development of more resolved emission inventories (i.e., vertically- and horizontally-resolved emissions at fine resolutions) and for more accurate and resolved air-quality and dispersion modeling. The models' resolutions are adjusted based on the specific project needs, but are typically in the order of 2 to 4 meters in the vertical direction (in the canopy layer) and 100 to 200 meters in the horizontal direction.
Activities under this effort also include collaborating with other researchers in developing urban parameterizations and characterizations and applying the models using these new data, e.g., NCAR / EPA NUDAPT effort.
Also see a paper in journal Atmospheric Environment:  https://doi.org/10.1016/j.atmosenv.2008.06.036 and two papers in journal Boundary Layer Meteorology:
  https://doi.org/10.1007/s10546-007-9258-6 and
  https://doi.org/10.1007/s10546-007-9259-5
